1. Strategy Introduction
Range trading (also known as grid trading) is an automated trading strategy that does not require predicting market direction. Both intraday charts and long-term candlestick patterns show that volatility is a primary market characteristic, and grid trading takes advantage of this feature to generate profits.
1.1 Advantages of the Strategy
- No need to forecast market trends
- No need to study fundamentals or news
- Automated high-sell low-buy to gain price differentials
- Suitable for most traders
- Can help generate additional income while holding quality assets
Usage Recommendations:
- Select trading pairs with good liquidity and moderate volatility
- Set reasonable trading ranges and grid spacing
- Be patient and allow the strategy to profit in a volatile market
- Regularly review and optimize strategy parameters
1.2 Applicable Scenarios
- Market oscillation phase: Prices fluctuate within a certain range
- Bottom building phase: Reduce costs through incremental buying
- High position reduction phase: Increase profits through incremental selling
- Intraday trading: Profit from intraday price fluctuations
2. Creating a Grid Trading Strategy
There are two ways to create a grid trading strategy:
2.1 Direct Creation
- Click the "Range Trading" button on the main interface
- Configure parameters in the pop-up settings window
2.2 Create from Holdings
- Right-click on the trading pair in the holdings list
- Select "Add to Range Trading Strategy"
- The system will automatically fill in the relevant parameters for the current holdings
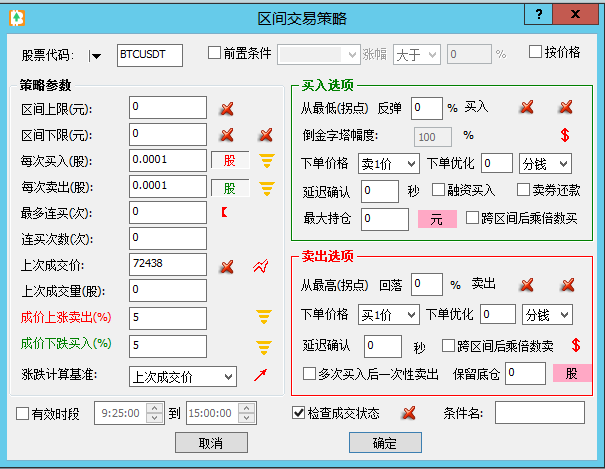
3. Parameter Settings
3.1 Range Parameters
| Parameter Name | Description |
|---|---|
| Upper Limit (Yuan) |
|
| Lower Limit (Yuan) |
|
| Buy Amount per Trigger |
|
| Sell Amount per Trigger |
|
3.2 Trading Condition Parameters
| Parameter Name | Description |
|---|---|
| Max Consecutive Buys |
|
| Consecutive Buy Count |
|
| Last Transaction Price |
|
| Last Transaction Volume |
|
| Price Increase Sell (%) |
|
| Price Decrease Buy (%) |
|
3.3 Pivot Point Parameters
| Parameter Name | Description |
|---|---|
| Lowest (Pivot) |
|
| Lowest (Pivot) Rebound Percentage |
|
| Highest (Pivot) |
|
| Highest (Pivot) Drop Percentage |
|
| Delay Confirmation Time |
|
3.4 Advanced Options
| Parameter Name | Description |
|---|---|
| Multiplier Buy After Crossing Ranges |
|
| Multiplier Sell After Crossing Ranges |
|
| Sell All After Multiple Buys |
|
| Check Transaction Status |
|
Advanced Options Usage Recommendations:
- It is recommended to become familiar with basic functions before using advanced options
- When using leveraged trading, be cautious of controlling capital risk
- Enabling transaction status checks can enhance strategy stability
3.5 Grid Matching Mode
Grid matching is an important advanced feature controlled by the red arrow button:
- The pressed state of the red arrow indicates that pairing grid prices is enabled
- Sales following consecutive purchases will match the previous purchase prices
- Ensures that each trade meets the expected profit target
| Function Description | Working Principle |
|---|---|
| Sell Matching |
|
| Buy Matching |
|
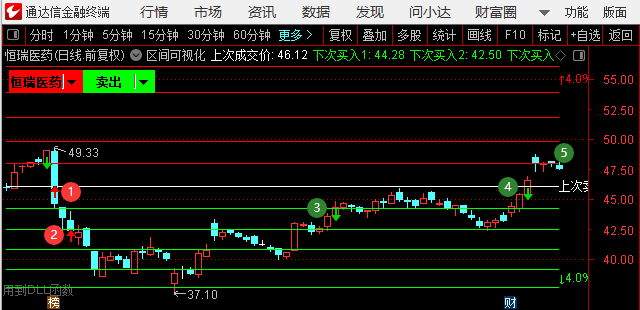
Example showing the difference between grid matching and non-matching
Example Explanation:
- After two consecutive buys at points ①②, the stock price continues to drop
- Operations are paused due to risk control or network disconnection
- At point ③, the price rises by 4%, executing the first sell
- When reaching point ④:
- If grid matching is not enabled: A sell is executed since the relative increase from ③ reaches 4%
- If grid matching is enabled: The comparison is made with the historical purchase price at ①, which does not meet the 4% increase, so no sell is executed
- It will only sell when the price continues to rise to point ⑤, reaching a 4% increase relative to ①
Advantages of Grid Matching:
- Ensures that each sale meets the expected profit target
- Avoids premature selling during minor fluctuations
- Increases the stability of the strategy's profitability
- Especially suitable for oscillating upward trends
- Requires the Premium version or higher for support
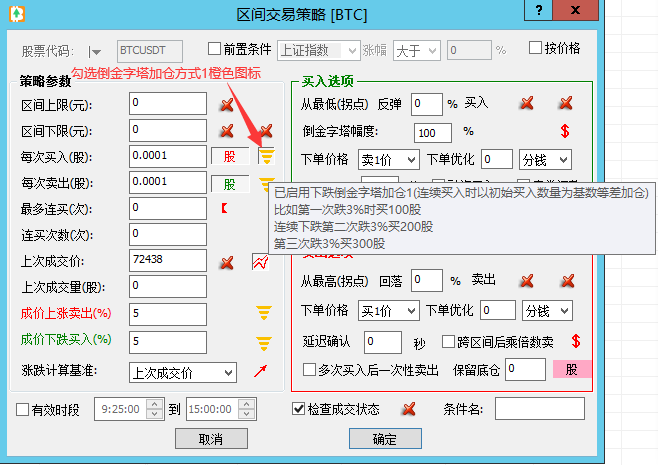
3.6 Inverse Pyramid Strategy Settings
3.6.1 Inverse Pyramid for Buy/Sell Quantities
Both buying and selling quantities support dynamic adjustments in an inverse pyramid manner:
| Direction | Description |
|---|---|
| Buy Quantity Inverse Pyramid |
|
| Sell Quantity Inverse Pyramid |
|
3.6.2 Inverse Pyramid for Buy/Sell Price Intervals
Both buy and sell trigger intervals support dynamic adjustments in an inverse pyramid manner:
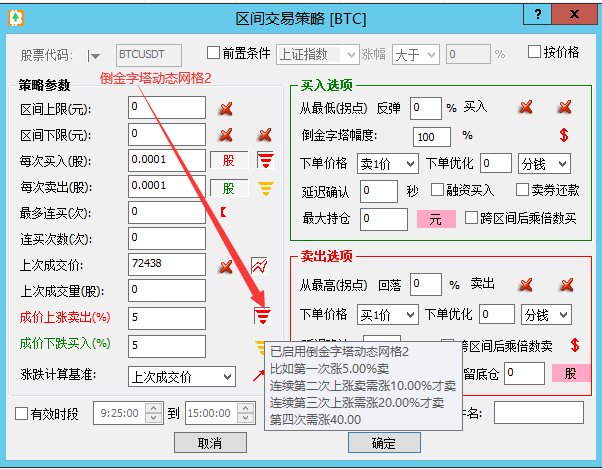
| Direction | Description |
|---|---|
| Buy Interval Inverse Pyramid |
|
| Sell Interval Inverse Pyramid |
|
Characteristics of Inverted Pyramid Strategy:
- Quantity Inverted Pyramid:
- Buying Direction: Suitable for gradually increasing position during a downward trend
- Selling Direction: Suitable for gradually increasing profit-taking intensity during an upward trend
- Can flexibly respond to trending markets
- Interval Inverted Pyramid:
- Buying Direction: Avoid exhausting funds too early during a unilateral decline
- Selling Direction: Avoid clearing positions too early during a strong rally
- Can dynamically adjust grid size to adapt to different market conditions
- Combination Usage Recommendations:
- Can use both quantity and interval inverted pyramids simultaneously
- Select appropriate increment based on market conditions and capital situation
- Pay attention to risk control to avoid excessive position buildup or holding
3.7 Other Important Settings
| Option Name | Description |
|---|---|
| Use of Transaction Price |
|
| Buy Option Check |
|
| Sell Option Check |
|
4. Statistics and Analysis
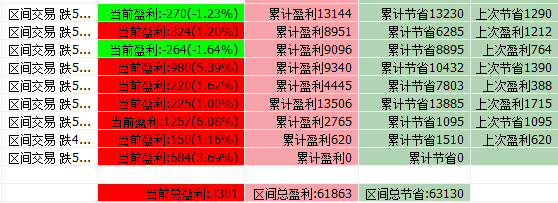
4.1 Interval Profit Statistics
The software provides complete grid trading statistics to help you analyze strategy effectiveness:
Interval Statistics List
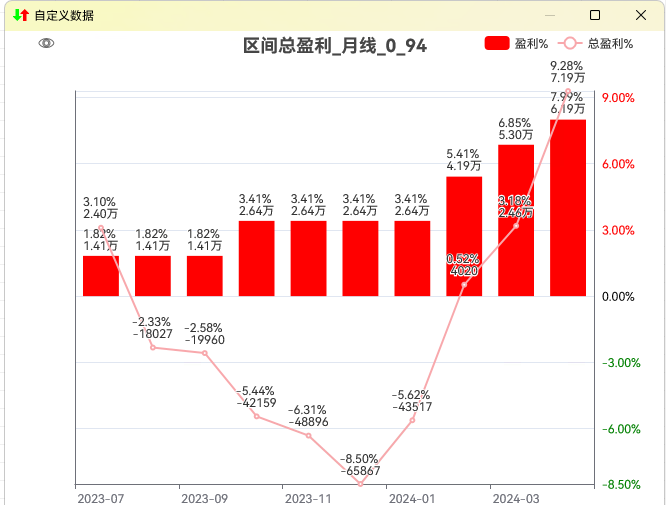
Monthly Total Profit Statistics Chart
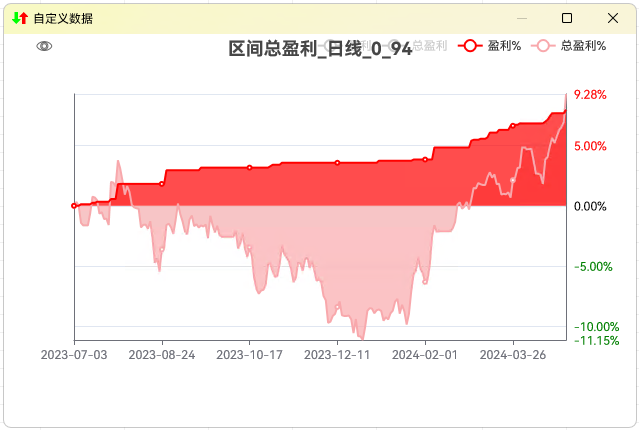
Total Profit Statistics Chart
| Statistical Indicator | Description |
|---|---|
| Interval Profit |
|
| Interval Savings |
|
4.2 Interval Savings Statistics
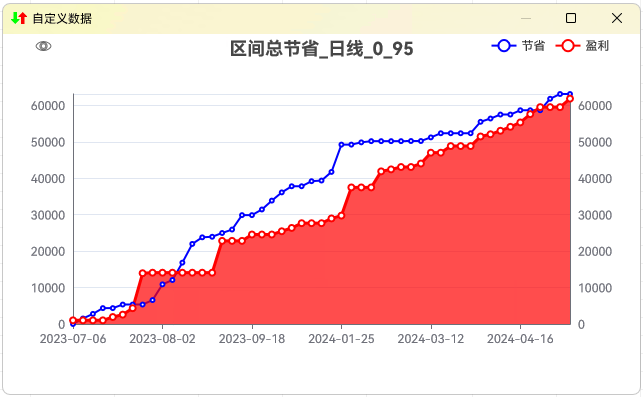
The blue line represents total savings for the interval, while the red line represents total profit for the interval.
Significance of Interval Savings Statistics:
- Reflects the effectiveness of strategy in building positions during a decline
- Helps evaluate the effectiveness of cost control
- The blue line above the red line indicates a choppy downward market
- Can help determine if strategy parameters are reasonable
4.3 Capital Curve Analysis
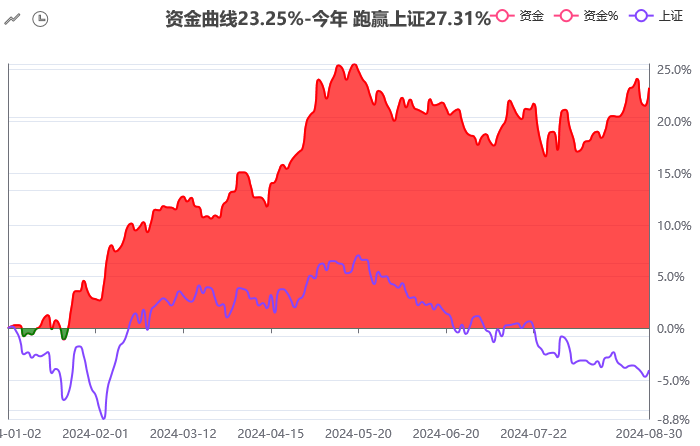
The red line represents strategy returns, while the purple line represents benchmark returns (e.g., Shanghai Composite Index).
| Analysis Dimension | Description |
|---|---|
| Return Comparison |
|
| Drawdown Analysis |
|
4.4 Data Record Viewing
Detailed trading records and statistical data can be viewed.
Viewing Method:
- Click the dropdown arrow next to the interval trading button.
- Select the type of statistical data to view:
- Total interval profit
- Total interval savings
- Monthly total profit
- Interval trading records
- Right-clicking on the capital curve can also show relevant statistics.
Suggestions for Using Statistical Functions:
- Regularly check statistical data to assess strategy effectiveness
- Compare performance over different periods to optimize parameters
- Enhance confidence in strategy execution through statistical data
- Be aware of the impact of the overall market environment